
What Does a VIX of 22 Actually Tell You?
You hear about the fear gauge, the VIX, all the time. If it reads 22, does that mean the market is scared? Here's what the VIX actually measures, how levels map to mood, and why volatility and direction are separate things.
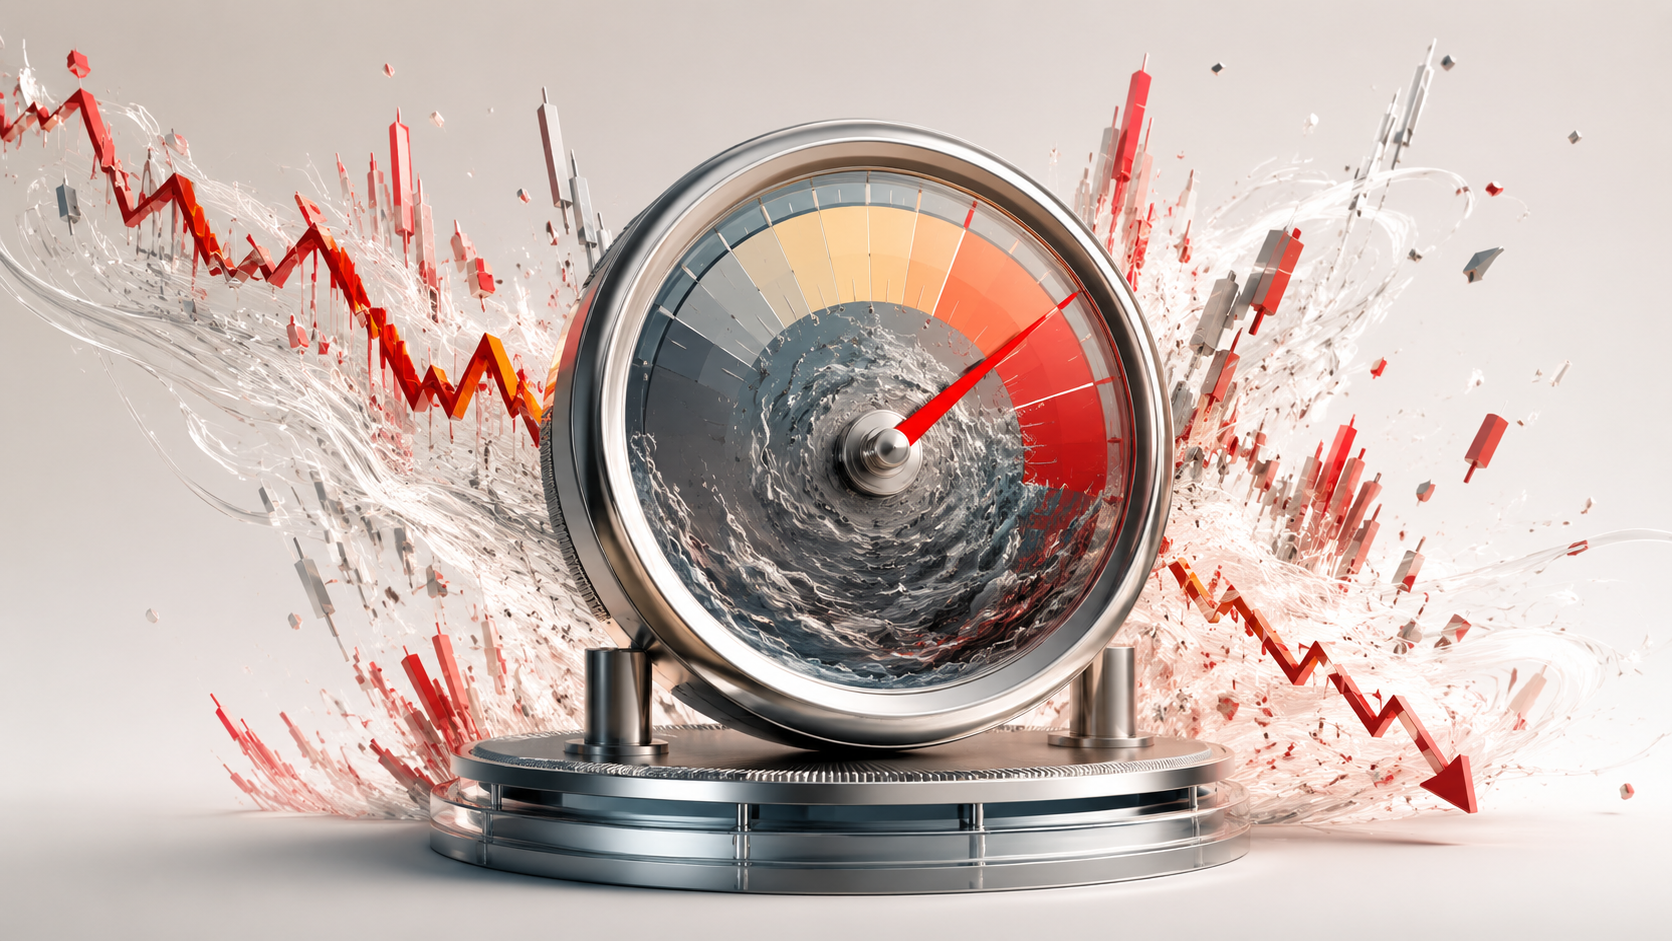
On days the market swings, the news never skips the line "the fear gauge, the VIX, spiked." In June 2026, ahead of a central bank meeting, the VIX climbed to around 22 before settling back below 16 within a few days. But what does that number, 22, actually mean? It might signal that the market is that scared, or it might point to something else entirely. Once you know what the VIX really measures, this number in the headlines reads far more clearly.
The VIX measures expected future swings
Start with what the number is measuring. The VIX expresses, as a single figure, how much the market expects the main US stock index to swing over the next month.
The key is that it's about the future, not the past. It doesn't measure swings that already happened — it shows how much people expect the market to move over the coming month. So it's less "how much is the market shaking right now" and more "how much do people think it will shake from here."
That expectation is pulled out of the price of options. An option is a kind of insurance against future price moves, and the more people expect big swings, the more that insurance costs. Work backward from how expensive that insurance has become, and you get the size of the swing the market expects. That's the VIX.
Reading what a 22 means
So what does a VIX of 22 mean specifically? The VIX is the expected swing range expressed as an annualized percentage.
A VIX of 22 roughly means the market expects the index to swing within a range of about 22% up or down over the coming year. Convert that to a one-month basis and it's around 6%. The higher the number, the bigger the swing people expect.
That's why the VIX gets used like a thermometer for market mood. The rough reading goes like this:
- Around 12 to 15: the market is calm, with little to worry about
- Around 20: a touch of tension in the air
- Above 30: anxiety has spread widely
- Past 40: close to outright panic
So June's 22 sat in that "slightly tense" zone — neither calm nor panic. Ahead of a big event like a central bank meeting, people priced in somewhat larger swings than usual.
Why it's called the fear gauge
There's a reason the VIX earned the nickname "fear gauge."
When the market rises calmly, people don't fuss much over insurance, so option prices stay low and the VIX stays low. When the market starts falling, more people rush to guard against losses, demand for that insurance piles up, option prices jump, and the VIX shoots higher. So the VIX has a habit of climbing especially sharply when markets drop.
Because of this, the VIX and stock prices usually move in opposite directions. You'll often see the VIX spike on days stocks fall hard. That mirror of the market's fear is what earned it the name.
Volatility and direction are different stories
Here's a misread worth catching: "high VIX means stocks fall." That's only half right.
The VIX measures the size of the swing, not the direction. A big swing carries both the chance of a big drop and the chance of a big rise. It's just that people tend to react more sharply when markets fall, so the VIX spikes more often in down markets. This connects straight to the idea of telling volatility apart from risk.
So a high VIX is a signal that "the market looks set to move a lot," not a prophecy that "it must fall." In reality, the VIX often spikes after a big shock and then settles as the market rebounds. Separating volatility from direction is the core of reading the VIX without getting fooled.
So how should you use the VIX?
For an investor, the VIX is useful as a secondary tool for reading the market's mood.
When the VIX is higher than usual, you can read it as the market being tense ahead of a big event or stretch of uncertainty. When it's pinned very low, some read it as the market getting complacent. Either way, it's safer to use the VIX as background for gauging the market's psychological state than to make a buy or sell decision off it alone.
Unless you're trading short term, there's little need to ride the ups and downs of any single day's VIX. It's more practical to watch what range the VIX usually moves in and whether today sits above or below that. How different a number is from its usual self tells you more than the number on its own.
The bottom line
The VIX is a number pulled from option prices that captures how much swing the market expects over the next month. A reading of 22 means people expect roughly a 22% range over the year — neither calm nor panic, just slightly tense. It climbs especially sharply when markets fall, which earned it the fear-gauge name, but it only measures the size of the swing, not the direction. So don't read a high VIX as an automatic drop — read it as a thermometer for market mood. How far the number sits from its usual range is the real signal.
- This information is not investment advice.
- Past performance does not guarantee future results.
- Backtest results are simulations and may differ from actual trading outcomes.
Kistack is an information service designed to help users review market data independently and form their own judgments. These backtests are historical simulations based on public market data and do not guarantee future investment returns. Past performance is not indicative of future results. Trading costs such as fees, taxes, and slippage are not reflected in simulations. Data is provided by Kistack; decisions are made by users.
This information is provided for educational and informational purposes only and does not constitute investment advice within the meaning of the Investment Advisers Act of 1940 (IAA) §206. Kistack is not a registered investment adviser and does not provide individualized buy or sell recommendations.
All performance figures shown are historical simulations. Disclosures regarding past performance and risk are presented in a manner intended to be fair, balanced, and not misleading, consistent with FINRA Communications Rule 2210. No statement on this site is intended to omit material facts or to mislead readers under SEC Rule 10b-5 of the Securities Exchange Act of 1934.