
Battery Industry Fundamentals: LFP vs NCM, CATL vs the World
CATL holds 40 percent of the global EV battery market. LFP vs NCM chemistry is reshaping competitive dynamics, and ESS demand from AI data centers is adding a new growth axis. Here is the structure behind the battery investment thesis.
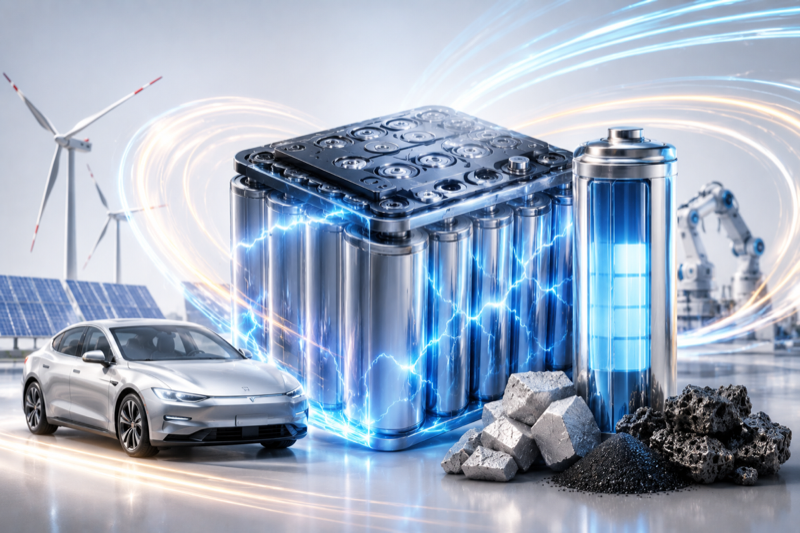
Electric vehicles are the most visible driver of battery demand, but the industry reshaping the global energy transition extends well beyond cars. Energy storage systems, AI data centers, grid stabilization, and portable electronics all depend on the same rechargeable battery technology. Understanding the chemistry, the competitive structure, and the demand trajectory is the foundation for evaluating any investment in this sector.
What a Rechargeable Battery Is
A secondary battery, or rechargeable battery, can be discharged and recharged repeatedly. The term distinguishes it from a primary battery, which is used once and discarded. Secondary batteries power smartphones, laptops, electric vehicles, and utility-scale energy storage installations.
The dominant technology in the current market is the lithium-ion battery. Its core components are an anode, a cathode, an electrolyte, and a separator. The cathode material is the primary differentiator between battery chemistries and the main driver of cost, performance, and safety trade-offs.
The cathode is where LFP and NCM diverge.
LFP: The Cost Leader
LFP stands for lithium iron phosphate. The cathode uses lithium, iron, and phosphate, none of which involve cobalt or nickel. This matters commercially because cobalt is expensive, geographically concentrated in the Democratic Republic of Congo, and subject to supply disruption risk.
LFP batteries cost roughly 20 to 30 percent less than NCM alternatives for equivalent energy storage. They are also thermally stable, with lower fire risk and longer cycle life. Degradation over thousands of charge-discharge cycles is slower than in NCM.
The trade-off is energy density. LFP packs less energy into a given volume or weight than NCM. For a vehicle application, this means either a heavier battery pack or a shorter range compared to an NCM system of the same physical size.
LFP now accounts for approximately 61 percent of global EV battery deployments. The shift reflects the industry's recognition that for standard-range vehicles and energy storage applications, the cost and safety advantages outweigh the energy density gap.
NCM: The Performance Option
NCM stands for nickel-cobalt-manganese. The cathode combines these three elements to achieve higher energy density than LFP. More energy in less space enables longer driving ranges in passenger vehicles without requiring heavier or larger battery packs.
NCM 523 (50 percent nickel, 20 percent cobalt, 30 percent manganese) is projected to account for roughly 42 percent of NCM revenue in 2026. Higher-nickel variants like NCM 811 push energy density further but require more careful thermal management and more complex manufacturing.
The cost disadvantage of NCM comes from cobalt and nickel pricing volatility and supply chain concentration. These raw material risks have driven battery makers to reduce cobalt content progressively, a trend that has continued for several years.
Premium automakers, performance EVs, and long-range applications continue to favor NCM for its superior energy density. But the economics increasingly favor LFP for cost-sensitive markets.
CATL: The Dominant Force
Contemporary Amperex Technology Company, known as CATL, is the world's largest battery manufacturer by volume. The company has held the top position among global EV battery suppliers for nine consecutive years.
CATL held approximately 39.2 percent of the global EV battery market in 2025, growing to 40.7 percent in Q1 2026. It commands operating margins of 10 to 15 percent under normal conditions, reaching 18 percent in 2025. The company spent more than 2.5 billion dollars on research and development in 2024 alone.
CATL has built its advantage on LFP, the chemistry where China's manufacturing scale and raw material integration are most decisive. The company has also developed its own cell-to-pack architecture, sodium-ion batteries for ultra-low-cost applications, and next-generation solid-state battery research.
In early 2025, CATL completed a secondary listing on the Hong Kong Stock Exchange, raising over 5 billion dollars to fund international expansion into Hungary, Spain, and Indonesia.
Western and Korean Competition
Korea's three major battery producers, LG Energy Solution, SK On, and Samsung SDI, collectively held approximately 16 percent of the global EV battery market in 2025. That combined share declined roughly 3.5 percentage points year over year as CATL and BYD extended their leads.
LG Energy Solution ranked third globally at approximately 9.3 percent market share. SK On held roughly 3.7 percent and Samsung SDI approximately 2.4 percent. All three have faced pressure from slower-than-expected EV demand growth in North America and Europe, combined with pricing pressure from Chinese competitors.
The response has been twofold. Korean producers are pursuing high-energy-density NCM innovation, including 4680-format cylindrical cells and solid-state battery development, as a technical differentiator against CATL's LFP cost advantages. They are also building LFP production capacity, recognizing that the market shift toward LFP is structural rather than cyclical. LG Energy Solution and Samsung SDI have both announced US LFP manufacturing partnerships with American automakers.
Micron and American battery startups have received significant US government support under the CHIPS and IRA frameworks to build domestic battery supply chains, though scale production remains years away.
ESS: The Second Growth Axis
Energy storage systems represent the fastest-growing battery application beyond vehicles. ESS installs battery packs at grid scale to store electricity from solar and wind generation and dispatch it when demand peaks or generation is insufficient.
Global ESS installations are projected to grow more than 40 percent in 2026, with North America representing approximately half of that expansion. The growth is driven by falling renewable energy costs, grid reliability requirements, and the enormous power demands of AI data centers.
A large-scale data center requires constant, stable power. Batteries can serve as an uninterruptible power supply at scale, bridging gaps between grid supply and demand. As AI infrastructure spending continues growing, the data center market is becoming a meaningful ESS demand driver alongside utility-scale grid storage.
LFP dominates ESS applications. The lower cost per kilowatt-hour, longer cycle life, and improved safety profile make it significantly better suited for stationary storage than NCM, where the energy density advantage over LFP matters much less when weight and volume are not constraints.
What to Watch When Evaluating Battery Investments
Investors who approach this sector by reasoning that more EVs sold means higher battery company profits miss several layers of complexity.
Battery pricing is under consistent downward pressure as scale increases and chemistry costs decline. Revenue growth does not automatically translate to margin expansion when your largest customer is also negotiating harder every year.
Raw material costs remain volatile. Lithium prices collapsed from their 2022 highs before recovering partially. Nickel, cobalt, and manganese pricing fluctuates with mining production, processing capacity, and speculative positioning.
Customer concentration creates risk. A battery maker heavily dependent on one automaker faces meaningful revenue volatility when that automaker adjusts production schedules.
Policy is a pivotal variable. The US Inflation Reduction Act created large tax credits for domestically produced EV batteries. Changes to that program alter the economics of US-sited battery manufacturing substantially. Chinese battery makers face tariff and trade barriers in Western markets that reshape the competitive landscape.
Geopolitics adds another layer. The US has imposed restrictions on importing Chinese battery cells that meet certain security definitions. How broadly those restrictions expand will determine whether CATL and BYD can access the US market directly or only through supply chain arrangements with Western producers.
Summary
The battery industry operates on two primary chemistries: LFP, which is cheaper and safer but less energy-dense, and NCM, which packs more energy per unit but costs more and involves riskier supply chains. CATL holds roughly 40 percent of the global EV battery market and is expanding internationally. Korean producers collectively hold about 16 percent, pursuing technical differentiation through higher-performance NCM while building LFP capability. ESS demand, driven by renewable energy expansion and AI data center power needs, is the fastest-growing battery segment and increasingly important to the revenue outlook for all major producers. Evaluating battery investments requires looking at pricing trends, raw material costs, customer concentration, and policy exposure simultaneously. EV sales volume is only one of several variables that ultimately determine whether battery manufacturers grow profitably.
- This information is not investment advice.
- Past performance does not guarantee future results.
- Backtested results are simulated and may differ from actual trading outcomes.
Kistack is an information service designed to help users review market data independently and form their own judgments. These backtests are historical simulations based on public market data and do not guarantee future investment returns. Past performance is not indicative of future results. Trading costs such as fees, taxes, and slippage are not reflected in simulations. Data is provided by Kistack; decisions are made by users.
This information is provided for educational and informational purposes only and does not constitute investment advice within the meaning of the Investment Advisers Act of 1940 (IAA) §206. Kistack is not a registered investment adviser and does not provide individualized buy or sell recommendations.
All performance figures shown are historical simulations. Disclosures regarding past performance and risk are presented in a manner intended to be fair, balanced, and not misleading, consistent with FINRA Communications Rule 2210. No statement on this site is intended to omit material facts or to mislead readers under SEC Rule 10b-5 of the Securities Exchange Act of 1934.